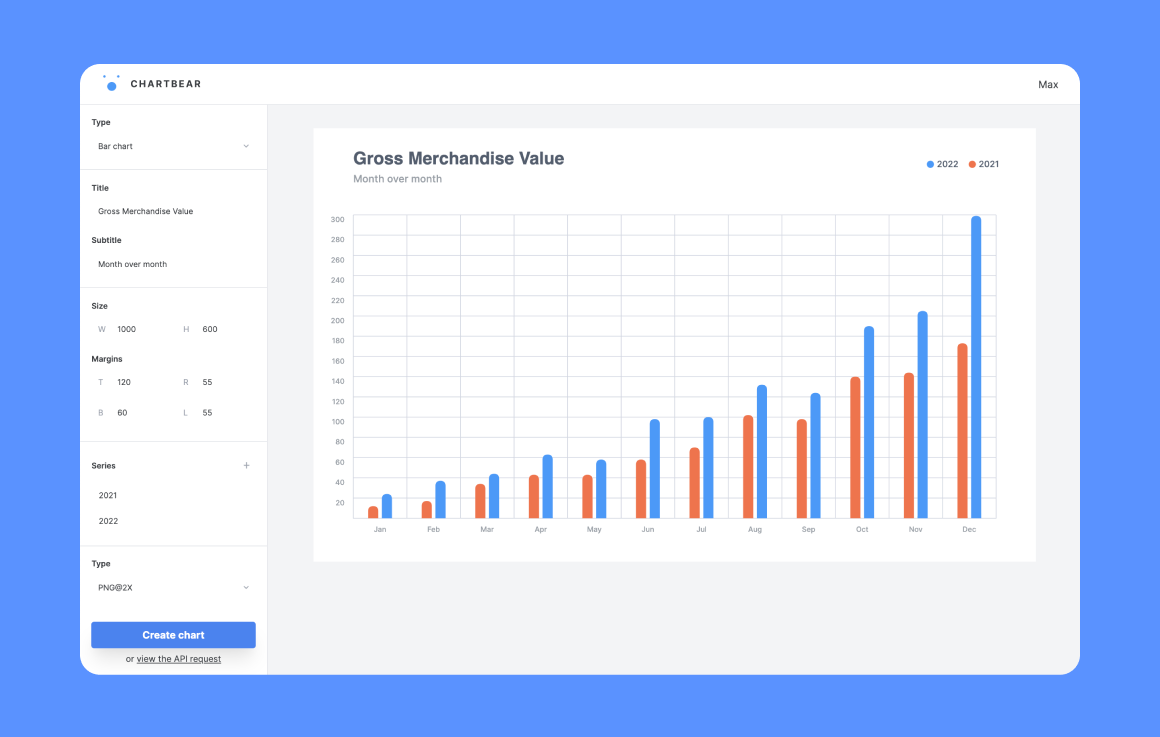
ChartBear: an API to create chart images
I’ve always been drawn to the indie maker scene and in the past, when I was still a freelance, I also tried to launch some products but I failed miserably… and that’s a good thing, right?
For five years now I’m a software engineer in a scaleup (and father of two, but that’s another story) so I have very little free time. Despite this, I kept following all the solo developers on Twitter for inspiration. I promised myself that I would have tried again at the first opportunity to solve my problem.
A few months ago I’ve been asked to build a reporting Slack bot for our internal stakeholders that had, among other things, to send them some charts. I evaluated some services during my make-or-buy process but I wasn’t totally satisfied by none of them, mainly for two reasons: firstly because in most of those services the data are sent as query parameters, and being sensitive data in my case I didn’t want that. The second reason was that the rendered chart images were not as cool as I wanted and I’m the kind of person who likes beautiful things 😎
So I did some testing and I realized there was room for a new API to create awesome charts in seconds so I started drawing some wireframes of what would become ChartBear
It took me 3 months of night work (just a couple of nights work per week and some weekends) but I finally launched the MVP! I did it all by myself: wireframe, design, copy and of course, development. The feeling of launching something that you made is awesome!

Like any self-respecting MVP, it went live with some trade-off. I already made the mistake of shipping a fully-featured product without even validating the idea so this time I tried to avoid that 😅
Some things I left out:
- More charts: I focused on the most common ones and I’ll build more if I gain some traction
- Dark theme: both for the website and the charts
- Writing tests (what about you? Do you write tests for an MVP?)
- Fancy animations
- CloudFront for serving the charts
It’s always hard to find the right trade-offs but I’m quite happy about my choices.
Tech stack
A few words about the tech stack for those who care about it:
- Laravel on the backend
- Typescript/Svelte/Tailwind on the frontend
- D3.js for producing the charts
- A node.js Lambda function for generating the chart images triggered from an API gateway
- Charts are then stored and served by an AWS S3 bucket
- Hosted on Heroku
It costs me 7$/month and the chart images are rendered in ~700ms on average and it’s already ready to scale! 💥
Get early access to ChartBear and please let me know your feedback!
Oh, I almost forgot the most important thing: I had a lot of fun building it!