ChartBear: an API to create chart images
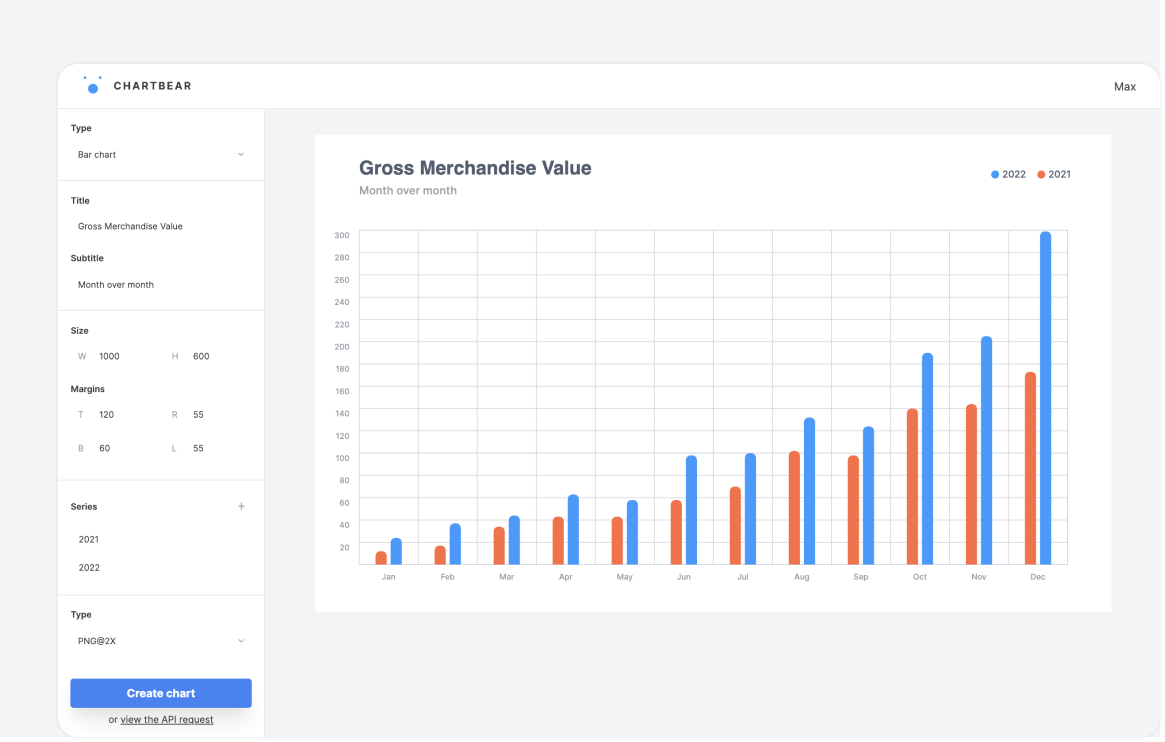
From the problem to the MVP: how ChartBear was born. It offers both an API and an editor to create awesome chart images in seconds.
Senior software engineer @rally
Indie maker by night
Experiments, considerations and some tips,
based on my daily experience
I'm based in
Verona, Italy

From the problem to the MVP: how ChartBear was born. It offers both an API and an editor to create awesome chart images in seconds.
I was looking for a small project to start learning Typescript and I ended up replacing my beloved Moleskine.
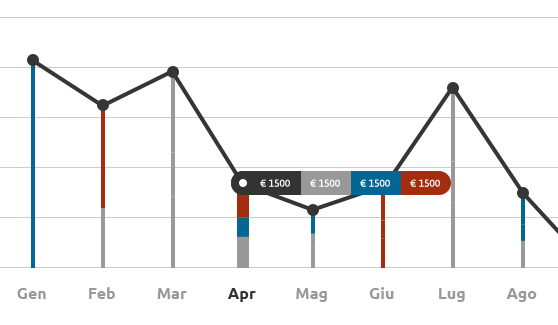
How I built the dashboard chart for an invoicing SaaS using D3.js and SVG.

A practical example, in this case a simple racing game, of Paper.js development. Both the vector graphics APIs and the vector mathematics (points, tangents, velocity, etc.) ones are used.

An in-depth experiment in the use of SVG for interface development: the grid of the NEST thermostat realized with SVG and TweenMax